Weekly Market Update #002
Market analysis for the week of 10 April 2025

The Trump Bluff
The Credit Market Alarm Bells
GDP, Liquidity and Crypto
The Trump Bluff
The US and China have been playing tit for tat all week as retaliatory tariffs flow back and forth across the table. Have Trump’s tactics just revealed all his cards and shown the world that he probably shouldn’t be taken too seriously? Was it all just strategic unpredictability? His initial aggressive tariff rates, followed by a sudden partial retreat back to 10% and a 90 day pause, suggest a dual intent: to use these trade levies as both a tool to punish his trade partners and as a bargaining chip, forcing concessions while maintaining flexibility to adjust course amid economic fallout. The escalation with China and the market volatility underscore the risks: while Trump may gain short-term leverage, his tactics could destabilize global trade and inflate U.S. consumer prices, contradicting his anti-inflation promises. Similarly to the last Trump term, it might be a great time to be a trader and capture the volatility.
Just how far could he really have pushed it and could it be that it was actually all just noise for asset prices when the real issue was liquidity? Let’s have a look.
The Credit Market Alarm Bells
Spreads in junk bond markets were widening at an accelerated pace right up to the tariff pause announcement. This shows us the yield that investors are demanding to hold onto junk rated bonds (the debt from zombie companies) vs the yield you could otherwise get by just holding US government treasuries.

It’s a common alarm bell that we are heading into a recession, especially when it rises this quickly. A metric worth watching over the coming weeks as traders and investors try to determine if this was a tradable low.
The MOVE index shows us the volatility in the US treasury market. Since the beginning of the bull market it has been trending down nicely within a definable range. Why is it important? The treasury market underpins the biggest form of collateral used when issuing credit and the more volatile the bond market is, the less credit can be issued against it. In layman’s terms, if the price of bonds is steady, you can issue ‘larger loans’ against those bonds than you could if the price looks like a memecoin chart.
The MOVE index since the beginning of the crypto bull market.
Prior to Trump’s big bluff, the yield curve was starting to slope south highlighting the risk of recession. A day later and it’s telling us not to panic just yet with cuts priced in to hit in 6 months. When do we cut like this? Typically in a recession. Cut rates and back to the Fed bailing out the treasury market once again.

So while the MOVE index has been pushed back into the range, the DXY chart shows dollar strength weakening, helping deliver a much-needed boost to global liquidity.

The Dollar index showing its drop from the start of the bull market along with its recent drop, supporting liquidity.
The other boost to global liquidity could be coming from the very countries the tariffs are threatening. These countries may need to boost their fiscal stimulus policies as a proactive measure to counteract any potential economic fallout. By imposing or threatening export taxes on major trading partners like China, Canada, Mexico, and the European Union, Trump has introduced uncertainty into global markets, raising fears of reduced export demand and disrupted supply chains. This uncertainty, coupled with the risk of retaliatory actions, pressures these nations to stimulate their domestic economies to balance out any anticipated declines in trade revenue and economic growth. For instance, countries like Japan and Germany, heavily reliant on exports to the U.S., may increase government spending or offer tax incentives to boost internal demand and shield their industries from the impact of higher trade barriers. Similarly, China might amplify its fiscal stimulus, such as infrastructure investments, subsidies or devaluing its currency, to maintain economic stability amid escalating trade tensions.
GDP, Liquidity and Crypto
What were the positives from all of this? One of the biggest takeaways is that GDP is likely going to be coming in hot over the next quarter. Anecdotal remarks across social media report many businesses are having booming sales since the tariff war began. All those consumers that were on the fence about a new car were suddenly highly motivated buyers to get in before the prices of everything soared under the ‘imminent’ new regime. This spike in growth will trickle into public company earnings over Q2 and may theoretically help investors justify another leg higher in risk assets across the stock market.
So stocks up? But what about crypto? Have we seen the bottom?
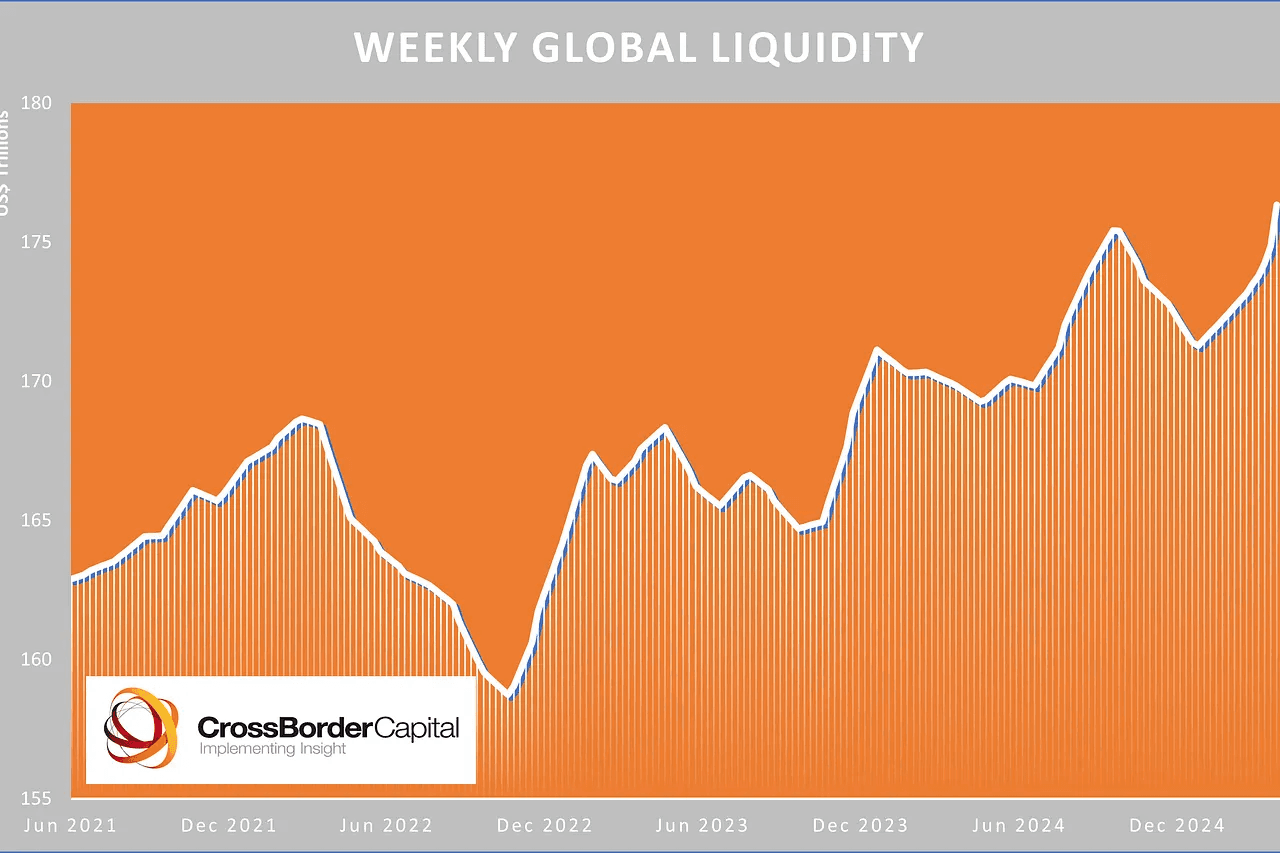
Bitcoin is still a risk asset and despite the wishes of the bitcoin maxis, has not managed to shake its high correlation to the stock market. The good news is we might not need to care. If stocks look to head higher, it’s probable that bitcoin and crypto will follow suit. Global liquidity tends to correlate to crypto with around a 13 week lead and we are nearing that point in time depending on how you measure it. We’ve double bottomed off typical fibonacci retracement zones and the 50 week simple moving average which could be providing enough confluence for technical traders to step in.
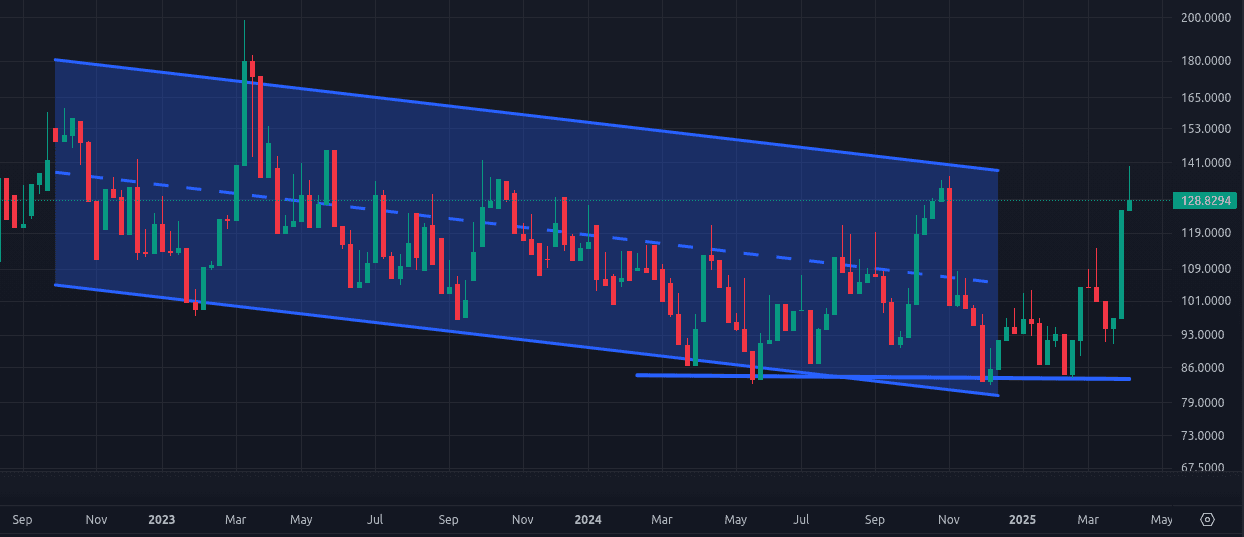
Volume is also one of crypto’s greatest metrics and Solana has no shortage of volume as it bounces back up into the range it has held for many months prior.
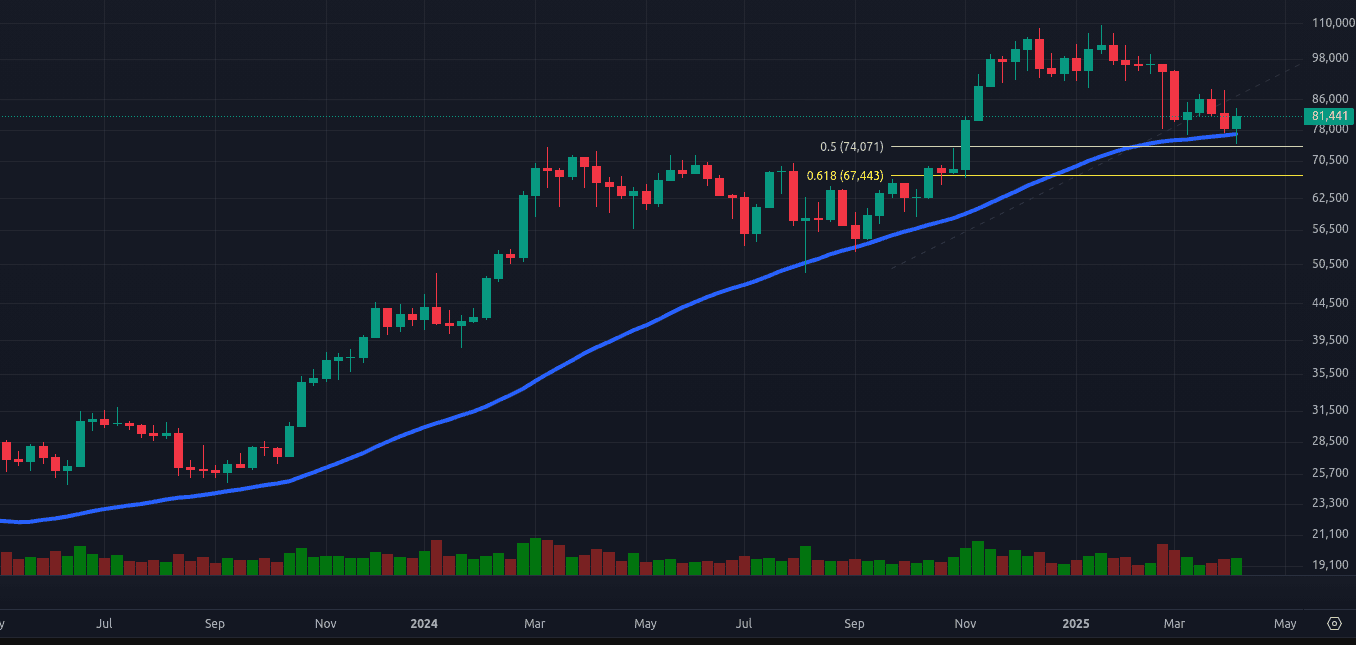
Bitcoin and the 50 week sma with fibonacci retracement levels holding up
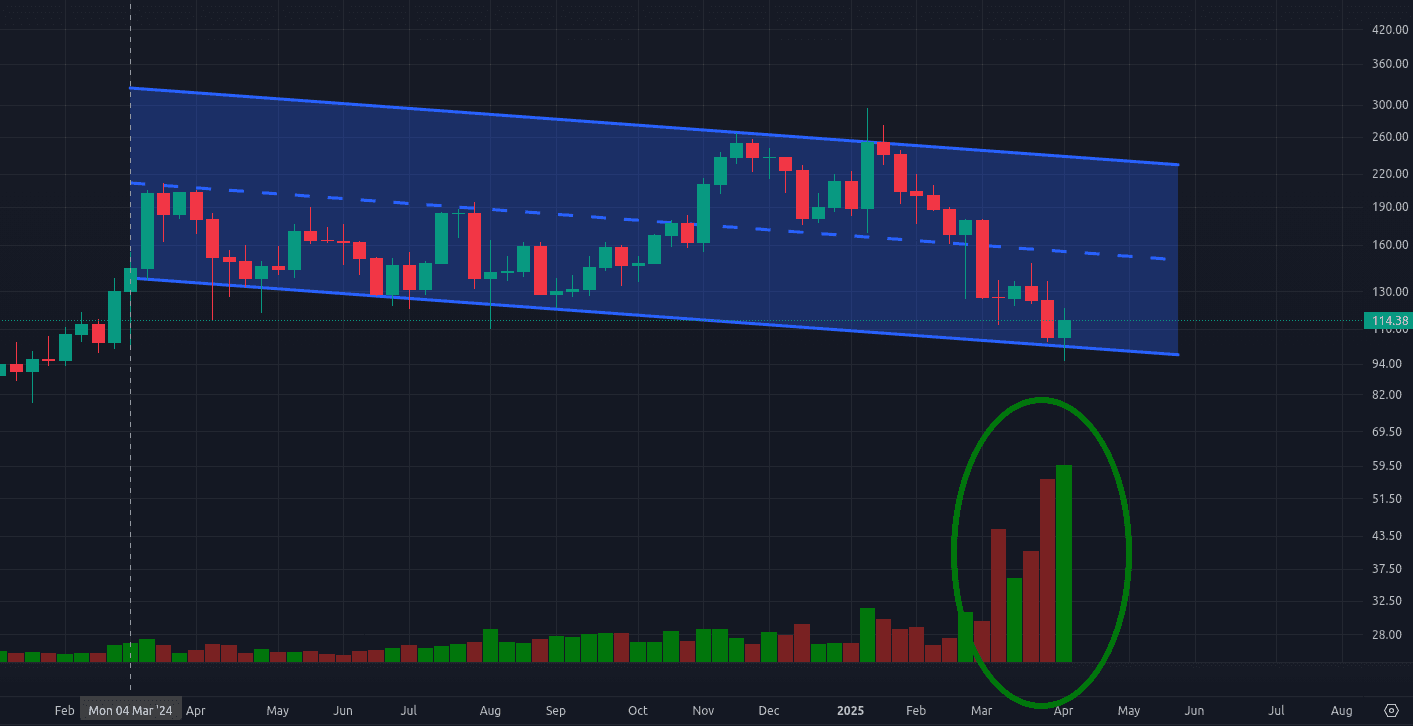
Solana and the biggest volume in over a year.